Lat: 39.48 Long: 70.47
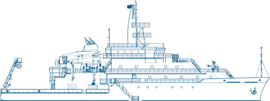
It’s weekend on land, but it’s a busy workday on board the R/V Neil Armstrong. I’ve joined the science party and crew on the vessel’s sixth science verification cruise intended to test its capabilities and capacity to handle various science objectives. Now on day two of six, we’re settling into a comfortable rhythm of sampling, assessing, and troubleshooting.
The ship aside, we’ve got a real cross-section of talent on board, including acousticians, biologists, and chemical and physical oceanographers all working toward a common goal: to characterize the waters along the continental shelf. Though very different from one another, each of the disciplines represented on board is complementary on this cruise. Physical oceanographers are following the interface between the water on the continental shelf (relatively warm and fresh “onshore” water) and offshore water, which is dotted with eddies spinning off from the Gulf Stream.
With any luck, we’ll be in position to take measurements of a “warm core ring,” eddies of much warmer water from the Gulf Stream contained in colder water around it that signal the presence of abundant marine life. Certainly that’s the hope of biologist Joel Llopiz and his student Christina Hernandez, who is basing her Ph.D. thesis on the occurrence of bluefin tuna larvae in the North Atlantic. Chief scientist Gareth Lawson also hopes to find northern krill, and everyone wants to see what types of deep-water “mesopelagic” fish can be pulled up from depths that commercial fishing vessels don’t typically reach.
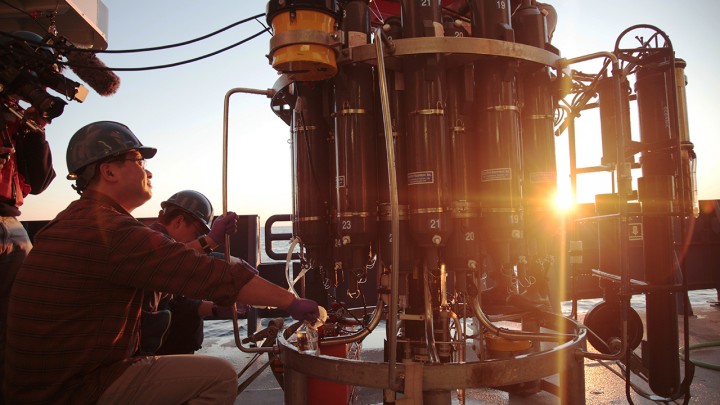
To find these creatures, we’ve got all kinds of nets, a CTD (an instrument that collects temperature and salinity data) mounted with an ADCP (acoustic doppler current profiler) to measure water currents, a Video Plankton Recorder, and the Simrad EK-80, a new instrument that works like an incredibly powerful fish-finder.
As we complete our cross-shelf transect, we’re passing within the Pioneer Array, a grid of moorings about 60 miles south of Martha’s Vineyard, which collect long-term, continuous data that complement the biological, chemical, and physical data obtained from the ship.
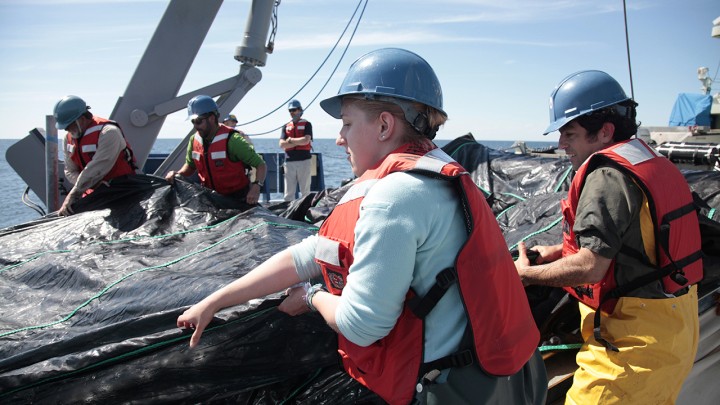
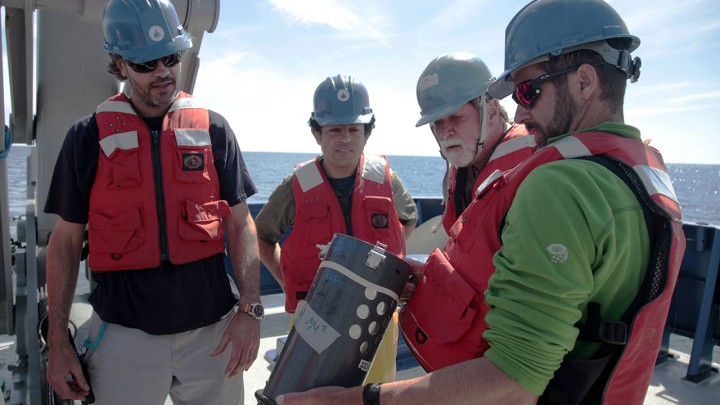
On Saturday, the MOCNESS-1 (the one-square-meter Multiple Opening and Closing Net with Environmental Sensing System) experienced “communication issues” that prevented the nets from opening, so the first two launches were unsuccessful. But by the third try, near the center of the Pioneer Array, the mechanical net worked like a charm. Each section empties into separate sampling tubes, which contained bright red shrimp, pinkish copepods, and other organisms when brought to the surface.
All the scientists have their eyes on the readout from the EK-80—though after spending the day watching acoustic scatter on the monitors, it’s a relief to finally see the green, blue, and red blobs translate into tangible biology. With settings from high to low acoustic frequencies, the broadband “echo sounder” can sense anything from zooplankton to large fish. The Neil Armstrong is only the second research vessel in the U.S. to be outfitted with this technology, and even the most experienced acousticians are still figuring out how to use it effectively.
Depending on the ship’s location and frequency, the rainbow-colored scattergram looks like anything from a minimalist watercolor to the dense bands of a Rothko. Andone Lavery—whose research contributed to the development of the EK-80 for scientific applications—can look at these layers and know, for example, that the dark red line at 40 meters is zooplankton, the green blobs could be squid, and the waves of green with dark red patches are more zooplankton that are dense enough to attract whales.
Acoustical pulses can also capture internal waves—moving underwater density changes that collect large amounts of marine life—as well as eddies that result from the convergence of warm, salty water and cooler, fresher water along the front of the continental shelf. (These are also shown in much broader resolution by ACDP and satellite readings.)
Although this data is interesting by itself, the EK-80 is being used to help scientists locate areas that are worthy of closer investigation. It helps scientists determine where to launch a CTD. At certain stations, biologists may also deploy a net—two different-sized MOCNESS, bongo nets, or a traditional trawl—to tow at depths from 90 to 2,000 meters. If it’s a MOCNESS, almost everyone goes inside to monitor the data from the EK-80, which helps them decide at which depths to open or close the nets. All this effort is to groundtruth (oceantruth?) what’s appearing on the screen with what eventually ends up in the nets.
Once samples are collected from the nets and separated into appropriate trays and vials, the scientists get busy. Working with some high-tech instrumentation, Denzhang Chu and Serdar Sakinan are figuring out the “acoustic material properties” of their specimens. Though not nearly as simple as matching fingerprints in a database with those at a crime scene, the idea is the same: if there’s an acoustic fingerprint, scientists can determine the type and density of the creatures displayed on the EK-80 monitor.
That’s the theory, anyway.
Prior to departing on this cruise, chief scientist Gareth Lawson summed up the reasons why biologists like him are turning to acoustics to better understand what’s happening in the big blue box below the ocean surface. He can explain things a lot better than I can so we’ll let him have the floor:
When we do our net sampling to confirm what we think is krill is actually krill, or what we think this fish is actually a fish, those are at very particular places in space and in time. And we want to know more about what’s going on in between. So the more we can get out of the acoustic data themselves, which is what we’re doing with the broadband, the better.
The density of the animals and the speed at which sound travels within the animal relative to the surrounding seawater is a key determinant of how much sound it scatters. [With broadband acoustics], you’re taking advantage of the fact that different kinds of organisms scatter differently as you change the acoustic frequency. We know the acoustic signatures of these organisms so we sample these particular frequencies to try and characterize these acoustic signatures . . . [w]hich gives us a lot more insight into both the kinds of organisms that are there as well as the sizes of organisms that are there.
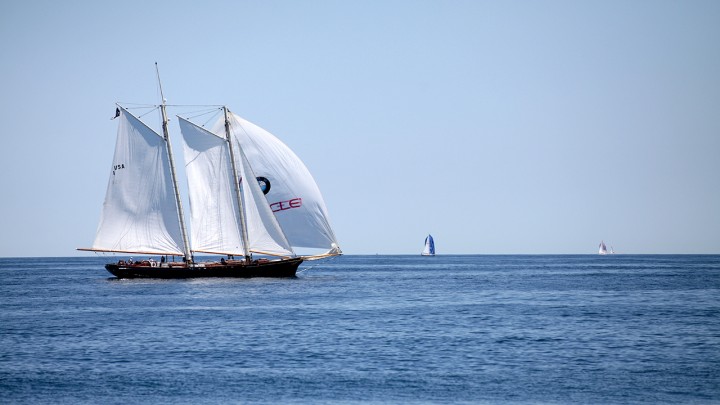
With all the focus on deck activities and what’s happening on different computer screens, it can be hard to remember where we are in the world. We get reminders from time to time when Jennifer Gatzke, a marine mammal observer from the Northeast Fisheries Science Center, radios the bridge that she’s seen a whale or dolphin. Yesterday, we even awoke to the sight of sailboats in our midst—the Newport-Bermuda Race—and had a sail-by visit from the schooner America, a replica of the boat for which the America’s Cup race is named. And while heading to our first station, we were escorted by a pod of dolphins playing in the ship’s wake, and last night many of us gathered on the bow for a sunset concerto complete with fin whale dives and blows.

